Your heart's electrical system controls all the events that occur when your heart pumps blood. The electrical system also is called the cardiac conduction system. The heart test called an ECG (electrocardiogram) is a graphical picture of the heart's electrical activity.
Your heart's electrical system is made up of three main parts:
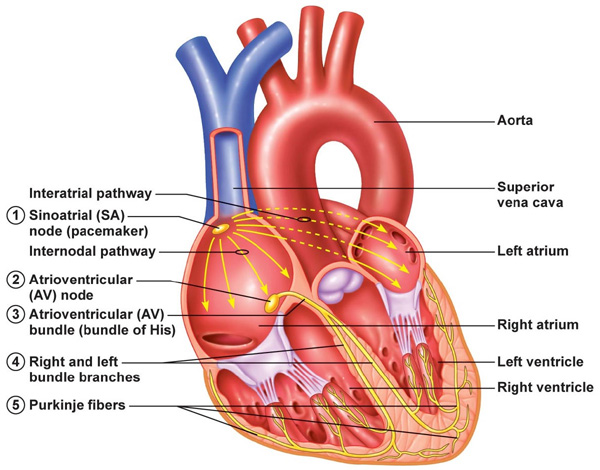
- The sinoatrial (SA) node, located in the right atrium of your heart.
- The atrioventricular (AV) node, located on the interatrial septum close to the tricuspid valve.
- The His-Purkinje system, located along the walls of your heart's ventricles.
A heartbeat is a complex cycle of electrical conductive events. These events take place inside and around your heart. A heartbeat is a single cycle in which your heart's chambers relax and contract to pump blood. This cycle includes the opening and closing of the inlet and outlet valves of the right and left ventricles of your heart. Each heartbeat has two basic parts: diastole and systole. During diastole, the atria and ventricles of your heart relax and begin to fill with blood.
At the end of diastole, your heart's atria contract (atrial systole) and pump blood into the ventricles. The atria then begin to relax. Your heart's ventricles then contract (ventricular systole), pumping blood out of your heart.
Two different types of cells in your heart enable the electrical signal to control your heartbeat:
i. Conducting cells carry your heart's electrical signal.
ii. Muscle cells enable your heart's chambers to contract, an action triggered by your heart's electrical signal.
The electrical signal travels through the network of conducting cell "pathways," which stimulates your upper chambers (atria) and lower chambers (ventricles) to contract. The signal is able to travel along these pathways by means of a complex reaction that allows each cell to activate one next to it, stimulating it to "pass along" the electrical signal in an orderly manner. As cell after cell rapidly transmits the electrical charge, the entire heart contracts in one coordinated motion, creating a heartbeat.
Heartbeat Conduction Cycle
(1) The sinoatrial (SA) node and the remainder of the conduction system are at rest.
(2) The SA node initiates the Action potential, which sweeps across the atria.
(3) After reaching the atrioventricular node, there is a delay of approximately 100 ms that allows the atria to complete pumping blood before the impulse is transmitted to the atrioventricular bundle.
(4) Following the delay, the impulse travels through the atrioventricular bundle and bundle branches to the Purkinje fibers, and also reaches the right papillary muscle via the moderator band.
(5) The impulse spreads to the contractile fibers of the ventricle.
(6) Ventricular contraction begins.

• Action potential: This gradual rise in electrical potential is called the pacemaker, or pre-potential. The rate of rise of the pacemaker potential is the main determinant of heart rate and is increased by adrenaline (epinephrine) and sympathetic stimulation and decreased by vagal (causing a drop in blood pressure) stimulation and hypothermia. Pacemaker activity normally only occurs in the SA and AV nodes, but there are latent pacemakers in other parts of the conducting system which take over when firing from the SA or AV nodes is depressed. Atrial and ventricular muscle fibres do not have pacemaker activity and discharge spontaneously only when damaged or abnormal.
The specialised cardiac conducting system consists of conducting tissue that is made up of modified cardiac muscle cells which have the property of automaticity, that is they can generate their own intrinsic action potentials (nerve impulses) as well as responding to stimulation from adjacent cells. The conducting pathways within the heart are responsible for the organised spread of action potentials within the heart and the resulting co-ordinated contraction of both atria and ventricles. In pacemaker tissue, after repolarisation has occurred, the membrane potential gradually rises to the threshold level for channel opening, at which point sodium floods into the cell and initiates the next action potential (nerve impulse).

The cells of the SA node at the top of the heart are known as the pacemaker of the heart because the rate at which these cells send out electrical signals determines the rate at which the entire heart beats (heart rate). The normal heart rate at rest ranges between 60 and 100 beats per minute. Your heart rate can adjust higher or lower to meet your body's needs. Your brain and other parts of your body send signals to stimulate your heart to beat either at a faster or a slower rate. Although the way all of the chemical signals interact to affect your heart rate is complex, the net result is that these signals tell the SA node to fire charges at either a faster or slower pace, resulting in a faster or a slower heart rate.
For example, during periods of exercise, when the body requires more oxygen to function, signals from your body cause your heart rate to increase significantly to deliver more blood (and therefore more oxygen) to the body. Your heart rate can increase beyond 100 beats per minute to meet your body's increased needs during physical exertion.
Similarly, during periods of rest or sleep, when the body needs less oxygen, the heart rate decreases. Some athletes actually may have normal heart rates well below 60 because their hearts are very efficient and don't need to beat as fast. Changes in your heart rate, therefore, are a normal part of your heart's effort to meet the needs of your body.
Catecholamines - During stress or a need for increased cardiac output, the adrenal glands release a hormone called norepinephrine into the bloodstream at the same time that the sympathetic nervous system is also triggered to increase your heart rate. This hormone causes the heart to beat faster, and unlike the sympathetic nervous system that sends an instantaneous and short-lived signal, norepinephrine released into the bloodstream increases the heart rate for several minutes or more.
Graphical ECG recording on paper
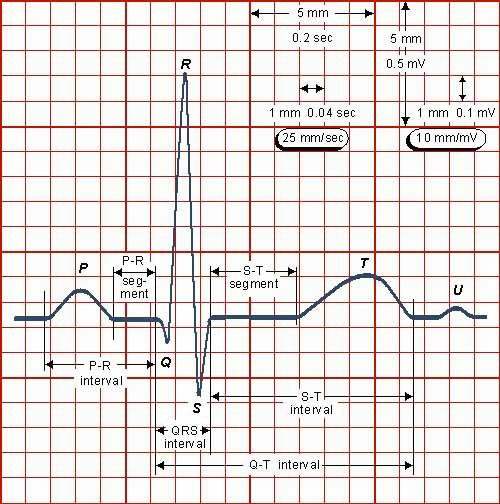
The ECG is usually recorded on a time scale of 0.04 seconds/mm on the horizontal axis and a voltage sensitivity of 0.1mv/mm on the vertical axis.
Therefore, on standard ECG recording paper, 1 small square represents 0.04seconds and one large square 0.2 seconds.
In the normal ECG waveform the P wave represents atrial depolarisation, the QRS complex ventricular depolarisation and the T wave ventricular repolarisation.
The P - R Interval is taken from the start of the P wave to the start of the QRS complex. The Q - T interval is taken from the start of the QRS complex to the end of the T wave. This represents the time taken to depolarise and repolarise the ventricles. The S - T segment is the period between the end of the QRS complex and the start of the T wave. All cells are normally depolarised during this phase.
ECG Normal values
P - R interval 0.12 - 0.2 seconds (3-5 small squares of standard ECG paper)
QRS complex duration less than or equal to 0.1 seconds (2.5 small squares)
Q - T interval corrected for heart rate (QTc) QTc = QT/ RR interval less than or equal to 0.44 seconds
Lead positions
The ECG may be used in two ways. A 12 lead ECG may be performed which analyses the cardiac electrical activity from a number of electrodes positioned on the limbs and across the chest. A wide range of abnormalities may be detected.
During anaesthesia, however, the ECG is monitored using only 3 (or occasionally 5) electrodes which provide a more restricted analysis of the cardiac electrical activity and cannot provide the same amount of information that may be revealed by the 12 lead ECG.
The term 'lead' when applied to the ECG does not describe the electrical cables connected to the electrodes on the patient. Instead it refers to the positioning of the 2 electrodes being used to detect the electrical activity of the heart. A third electrode acts as a neutral.
During anaesthesia one of 3 possible 'leads' is generally used. These leads are called bipolar leads as they measure the potential difference (electrical difference) between two electrodes. Electrical activity travelling towards an electrode is displayed as a positive (upward) deflection on the screen, and electrical activity travelling away as a negative (downward) deflection. The leads are described by convention as follows:
Lead I - measures the potential difference between the right arm electrode and the left arm electrode. The third electrode (left leg) acts as neutral.
Lead II - measures the potential difference between the right arm and left leg electrode.
Lead III - measures the potential difference between the left arm and left leg electrode.
Most monitors can only show one lead at a time and therefore the lead that gives as much information as possible should be chosen. The most commonly used lead is lead II - a bipolar lead with electrodes on the right arm and left leg. This is the most useful lead for detecting cardiac arrhythmias as it lies close to the cardiac axis (the overall direction of electrical movement) and allows the best view of P and R waves.
Sources:
http://archive.cnx.org/contents/ef365738-1b72-4234-8bb3-f994538801c8@1/cardiovascular-system-module-4-cardiac-muscle-and-electrical-activity
http://www.webmd.com/heart/tc/electrical-system-of-the-heart-topic-overview#1
https://www.nhlbi.nih.gov/health/health-topics/topics/hhw/electrical
Compiled by John Sandham