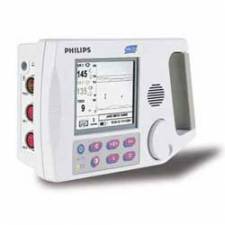
This article will discuss the basic principles of using ECG monitoring (Cardiac Monitoring).
Cardiac arrhythmias during anaesthesia and surgery occur in up to 86% of patients. Many are of clinical significance and therefore their detection is of considerable importance.
The continuous oscilloscopic ECG is one of the most widely used anaesthetic monitors. A 12 lead ECG recording will provide much more information than is available on a theatre ECG monitor, and should where possible, be obtained pre-operatively in any patient with suspected cardiac disease.
The ECG is a recording of the electrical activity of the heart. It does not provide information about the mechanical function of the heart and cannot be used to assess cardiac output or blood pressure. Cardiac function under anaesthesia is usually estimated using frequent measurements of blood pressure, pulse, oxygen saturation, peripheral perfusion and end tidal CO2 concentrations.
Cardiac performance is occasionally measured directly in more serious theatre patient using invasive blood pressure measurement or oesophageal Doppler techniques, although this is uncommon.
The ECG monitor should always be connected to the patient before induction of anaesthesia or institution of a regional block. This will allow the anaesthetist to detect any change in the appearance of the ECG complexes during anaesthesia.
Connecting an ECG monitor
Although an ECG trace may be obtained with the electrodes attached in a variety of positions, conventionally they are placed in a standard position each time so that abnormalities are easier to detect. Most monitors have 3 leads and they are connected as follows:
Red - RA - right arm, (or second intercostal space on the right of the sternum)
Yellow - LA - left arm (or second intercostal space on the left of the sternum)
Green (or Black) - LL - left leg (or more often in the region of the apex beat.)
This will allow the Lead I, II or III configurations to be selected on the ECG monitor. Lead II is the most commonly used.
The cables from the electrodes usually terminate in a single cable, which is plugged into the port on the ECG monitor. A good electrical connection between the patient and the electrodes is required to minimise the resistance of the skin. For this reason gel pads are used to connect the electrodes to the patients skin. However when the skin is sweaty the electrodes may not stick well, resulting in an unstable trace. When electrodes are in short supply they may be reused after moistening with saline or gel before being taped to the patient's chest.
Principles of the ECG
The ECG is a recording of the electrical activity of the heart. An electrical recording made from one myocardial muscle cell will record an action potential (the electrical activity which occurs when the cell is stimulated). The ECG records the vector sum (the combination of all electrical signals) of all the action potentials of the myocardium and produces a combined trace.
At rest the potential difference across the membrane of a myocardial cell is -90mv. This is due to a high intracellular potassium concentration, which is maintained by the sodium/potassium pump.
[Depolarisation of a cardiac cell occurs when there is a sudden change in the permeability of the membrane to sodium. Sodium floods into the cell and the negative resting voltage is lost. Calcium follows the sodium through the slower calcium channels resulting in binding between the intracellular proteins actin and myosin which results in contraction of the muscle fibre. The depolarisation of a myocardial cell causes the depolarisation of adjacent cells and in the normal heart the depolarisation of the entire myocardium follows in a co-ordinated fashion. During repolarisation potassium moves out of the cells and the resting negative membrane potential is restored].
The Conducting System of the Heart
The specialised cardiac conducting system consists of:
Conducting tissue is made up of modified cardiac muscle cells which have the property of automaticity, that is they can generate their own intrinsic action potentials (nerve impulses) as well as responding to stimulation from adjacent cells. The conducting pathways within the heart are responsible for the organised spread of action potentials within the heart and the resulting co-ordinated contraction of both atria and ventricles.
In pacemaker tissue, after repolarisation has occurred, the membrane potential gradually rises to the threshold level for channel opening, at which point sodium floods into the cell and initiates the next action potential (nerve impulse).
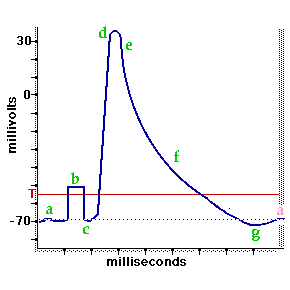
Action Potential
This gradual rise is called the pacemaker, or pre-potential. The rate of rise of the pacemaker potential is the main determinant of heart rate and is increased by adrenaline (epinephrine) and sympathetic stimulation and decreased by vagal (causing a drop in blood pressure) stimulation and hypothermia. Pacemaker activity normally only occurs in the SA and AV nodes, but there are latent pacemakers in other parts of the conducting system which take over when firing from the SA or AV nodes is depressed. Atrial and ventricular muscle fibres do not have pacemaker activity and discharge spontaneously only when damaged or abnormal.
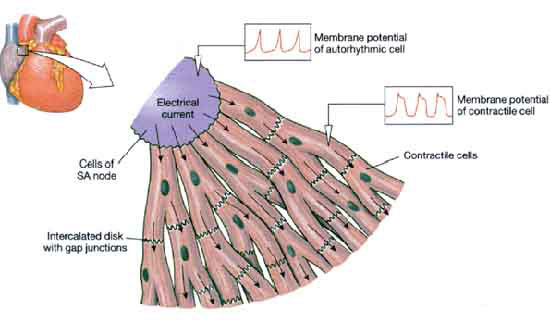
Graphical Recording On a paper trace,
 The ECG is usually recorded on a time scale of 0.04 seconds/mm on the horizontal axis and a voltage sensitivity of 0.1mv/mm on the vertical axis.
Therefore, on standard ECG recording paper, 1 small square represents 0.04seconds and one large square 0.2 seconds.
In the normal ECG waveform the P wave represents atrial depolarisation, the QRS complex ventricular depolarisation and the T wave ventricular repolarisation.
The P - R Interval is taken from the start of the P wave to the start of the QRS complex. The Q - T interval is taken from the start of the QRS complex to the end of the T wave. This represents the time taken to depolarise and repolarise the ventricles.
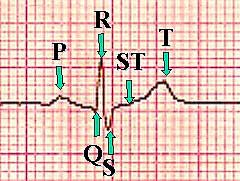
The S - T segment is the period between the end of the QRS complex and the start of the T wave. All cells are normally depolarised during this phase.
ECG Normal Values
- P - R interval 0.12 - 0.2 seconds (3-5 small squares of standard ECG paper)
- QRS complex duration less than or equal to 0.1 seconds (2.5 small squares)
- Q - T interval corrected for heart rate (QTc) QTc = QT/ RR interval less than or equal to 0.44 seconds
Lead Positions
The ECG may be used in two ways. A 12 lead ECG may be performed which analyses the cardiac electrical activity from a number of electrodes positioned on the limbs and across the chest. A wide range of abnormalities may be detected.
During anaesthesia, however, the ECG is monitored using only 3 (or occasionally 5) electrodes which provide a more restricted analysis of the cardiac electrical activity and cannot provide the same amount of information that may be revealed by the 12 lead ECG.
The term 'lead' when applied to the ECG does not describe the electrical cables connected to the electrodes on the patient. Instead it refers to the positioning of the 2 electrodes being used to detect the electrical activity of the heart. A third electrode acts as a neutral. During anaesthesia one of 3 possible 'leads' is generally used. These leads are called bipolar leads as they measure the potential difference (electrical difference) between two electrodes. Electrical activity travelling towards an electrode is displayed as a positive (upward) deflection on the screen, and electrical activity travelling away as a negative (downward) deflection. The leads are described by convention as follows:
Lead I - measures the potential difference between the right arm electrode and the left arm electrode. The third electrode (left leg) acts as neutral.
Lead II - measures the potential difference between the right arm and left leg electrode.
Lead III - measures the potential difference between the left arm and left leg electrode.
Most monitors can only show one lead at a time and therefore the lead that gives as much information as possible should be chosen. The most commonly used lead is lead II - a bipolar lead with electrodes on the right arm and left leg. This is the most useful lead for detecting cardiac arrhythmias as it lies close to the cardiac axis (the overall direction of electrical movement) and allows the best view of P and R waves.


