Spirometers are devices used to check lung function, flow volume and volume time curves.
 Spirometry is relatively easy to administer and standardise and has become portable enough to use at outreach clinics as well as in hospitals. The increasing availability of spirometry has led to greater use by both primary care physicians and specialists, some of whom may lack formal training in interpreting results.
Spirometry should be interpreted using the flow volume and volume time curves as well as the absolute values for flows and volumes. The flow volume loop and volume time curve are often overlooked but provide valuable information. Certain disease states have characteristically shaped loops, so it is important to be able to recognise the different patterns.
 Normal values for Forced expiratory volume (FEV) and Forced vital capacity (FVC) are based on population studies and vary according to race, height, age, and gender. They are expressed in both absolute numbers and percent predicted of normal. Some authors have suggested that defining normal by 95% confidence intervals would be more statistically appropriate, particularly at the extremes of age. Thus, a value below the 5th percentile is defined as "below the lower limit of normal." However, many laboratory and computer software programs continue to express results as percentages of predicted normal values. A physician's interpretative strategy should be adaptable to either reporting system.
Values for FVC and FEV that are over 80% of predicted are defined as within the normal range. The FEV/FVC ratio is expressed as a percentage, and a normal young individual is able to forcibly expire at least 80% of his/her vital capacity in one second. A ratio under 70% suggests underlying obstructive physiology; however, the FEV/FVC ratio declines as a normal result of ageing. Thus, at advanced ages, pathologic airways obstruction is diagnosed based upon deviation from predicted FEV/FVC values, with values below the 5th percentile best selecting patients with obstructive defects.

A normal flow volume loop has a rapid peak expiratory flow rate with a gradual decline in flow back to zero. The inspiratory portion of the loop is a deep curve plotted on the negative portion of the flow axis. Inspiratory data is often overlooked, but the flow volume loop gives the opportunity of assessing this information as well.

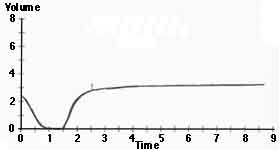
The normal volume time curve has a rapid upslope and approaches a plateau soon after exhalation. The maximum volume attained represents the forced vital capacity (FVC), while the volume attained after one second represents the forced expiratory volume (FEV).
Obstructive lung disease
the primary abnormality detected by spirometry is airways obstruction. In obstructive lung diseases such as emphysema or chronic bronchitis, the FEV is reduced disproportionately more than the FVC resulting in an FEV/FVC ratio less than 70 - 80%. This reduced ratio is the primary criteria for diagnosing obstructive lung disease by spirometry.

As the obstruction becomes more severe and end expiratory air trapping develops, the forced vital capacity may be reduced as well as the FEV; however there should continue to be a disproportionate reduction in FEV as evidenced by the FEV/FVC ratio.


Obstructive lung disease also changes the appearance of the flow volume curve. As with a normal curve, there is a rapid peak expiratory flow, but the curve descends more quickly than normal and takes on a concave shape. With more severe disease, the peak becomes sharper and the expiratory flow rate drops precipitously. This results from dynamic airway collapse which occurs as diseased conducting airways are more readily compressed during forced expiratory efforts. On the volume time curve, this is seen as a slower ascent to maximum volume, with a gradual upsloping versus the rapid rate seen in normal individuals. This equates with a prolonged forced expiratory time demonstrable on physical exam.
As mentioned above, there is a normal age-related decline in the FEV/FVC ratio, so normal elderly patients without airway obstruction will have a ratio below 70-80%. In this case, values below the predicted FEV/FVC ratio aid in diagnosing obstruction. The mid-range flows are always reduced in obstructive airways disease. In the appropriate clinical setting, one may consider a trial of bronchodilators, bronchoprovocative testing to exclude asthma, or interpret this observation as a possible early indicator of smoking related lung disease.


