 In human physiology, volume of blood expelled by either ventricle of the heart. It is customarily expressed as minute volume, or litres of blood per minute, calculated as the product of stroke volume (output of either ventricle per heartbeat) and the number of beats per minute. Maintaining and regulating cardiac output, which is usually proportional to the tissues' need for oxygen and other nutrients, is one of the circulatory system's most intricate functions. In the healthy human adult, resting (or basal) output is estimated to be slightly over five litres per minute.
The cardiac output represents the volume of blood that is delivered to the body, and is therefore an important factor in the determination of the effectiveness of the heart to deliver blood to the rest of the body, (i.e., determining heart failure, inadequate circulation, etc). By definition, two major factors contribute to the cardiac output: the heart rate, which is the number of times a given volume of blood is ejected per unit of time, and the stroke volume, which is effectively the volume of blood that the heart can fill with, which will be ejected upon contraction. Increasing the heart rate effectively increases the cardiac output by increasing the number of cardiac volumes of blood released into the system. As long as the heart is given a long enough diastole (resting phase), the effective volume that the heart outputs will increase. The stroke volume can be increased by three different factors: the preload, the afterload, and the myocardial contractility.
A high venous pressure (preload) can increase the stroke volume by causing the heart to fill more fully during diastole. The increased blood pressure forces more blood to flow into the heart, down a steep pressure gradient. Similarly, a decrease in the afterload (arterial blood pressure) can also increase cardiac output, by reducing the input resistance the heart must overcome in order to pump blood into the vasculature. If the arterial pressure is high, the heart must work harder, against a steep pressure gradient in order to pump more blood into the system. If the arterial pressure is lower, the heart need not work as hard, and more of the total heart volume actually ends up being ejected into the vasculature. The myocardial contractility affects the pumping efficiency of the heart. A higher contractility allows the heart to pump out more of its blood during systole, due to the increased ejection force of the cardiac muscles. By allowing the heart to pump out more of its volume into the vasculature (high cardiac efficiency), the cardiac output is increased.
Assessment of the cardiac output is important in determining the work that the heart is actually performing with respect to the rest of the cardiovascular system. If the cardiac output is too low, then the body is not being properly supplied with blood (heart failure), which can and will lead to life threatening problems if left unchecked. Cardiac Output is usually measured using the Fick Principle (German physiologist Adolf E. Fick), which relates the cardiac output of the patient to the oxygen consumption, or by thermodilution, in which cold saline is injected into the right atrium and changes in the temperature in the pulmonary artery are recorded. These methods allow one to determine the amount of blood being delivered to the vasculature by the heart, and whether its output is sufficient to sustain the health of the patient.

Cardiac output is calculated as a function of both peripheral and cardiac factors
The important influences are blood volume, total peripheral resistance, and heart strength.
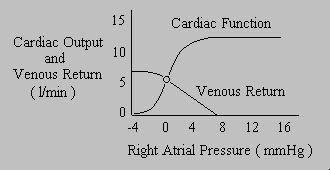
Blood volume and total peripheral resistance influence venous return. Heart strength influences cardiac output. Over the long term, cardiac output and venous return are equal, leading to a rather complex algebraic relationship.
Guyton's cardiac function and venous return curves provide a graphical solution to these equations.

Terminology used when dealing with cardiac output
SPAP PAP SYSTOLIC (Pulmonary Artery Pressure Systolic) represents the rapid blood flow from the right ventricle into the pulmonary artery. Occurs with the opening of the pulmonic valve.
Normal: 15-30mmHg
DPAP PAP DIASTOLIC (Pulmonary Artery Pressure Diastolic) represents the diminished blood flow from the right ventricle into the pulmonary artery. Occurs with the closure of the pulmonic valve.
Normal: 5-15mmHg
MPAP (Mean Pulmonary Artery Pressure) is calculated as follows: (DPAP x 2) + SPAP
Normal: 7-16mmHg
PCWP (Pulmonary Capillary Wedge Pressure) is an indirect indicator of left ventricular filling pressure or preload. When the balloon of the PA catheter is inflated, a branch of the pulmonary artery is occluded. The pressure that is transmitted by the pulmonary vein is approximately the same as the lead atrial pressure because there are no valves is the lung vasculature that would create a change in pressure between the left ventricle and the pulmonary vein.
Normal: 8-12mmHg
CVP (Central Venous Pressure) measures right ventricular end diastolic pressure or right ventricular preload.
Normal: 2-6mmHg
C.O. (Cardiac Output) is the volume of blood that is ejected from the heart with each contraction per minute.
Normal: 4-8L/min
C.I. (Cardiac Index) takes into account body size and cardiac output. It is a more precise measurement.
Normal: 2.5-4l/min/m2
SV (Stroke Volume) is the quantity of blood ejected from the ventricle with each contraction. Stroke volume looks at ventricular performance or ejection without heart rate influence.
Normal: 60-100ml/beat
SVI (Stroke Volume Index) is the quantity of blood ejected from the heart, indexed to take into account body size. It is a more precise measurement.
Normal: 33-47ml/beat/m2
SVR (Systemic Vascular Resistance) measures the afterload or resistance applied to the left ventricle. It is an indicator of the left ventricular afterload. It is the force impeding the ejection of blood from the left ventricle.
Normal: 800-1200dynes/sec/cm2
PVR (Pulmonary Vascular Resistance) measures the resistance or impedance of blood flow from the right ventricle against the pulmonary circulation. It measures resistance across the entire lung field.
Normal: 150-250dynes/sec/cm5
RVSWI (Right Ventricular Stroke Work Index) measures the amount of work that the right ventricle does during each contraction. It is a means of evaluating the pumping function of the right ventricle.
Normal: 10-15gm/M/M2/beat
LVSWI (Left Ventricular Stroke Work Index) measures the amount of work the left ventricle does during each contraction. It is a means of evaluating the pumping function of the left ventricle. It is the best measurement of contractility.
Normal: 45-75gm/M/M2/beat
CaO2 (Arterial Oxygen Content) is the actual amount of oxygen found bound to hemoglobin and dissolved in the plasma in each l00cc of arterial blood.
Normal: 17-20ml/dl
avDO2 (Arteriovenous Oxygen Content Difference) is the difference between the arterial oxygen content and the mixed venous oxygen content (CaO2 - CvO2). As tissue extraction increases and mixed venous oxygen content decreases, avDO2 increases.
Normal: 4.2-5.0ml/dl
DO2I (Oxygen Delivery Index) or O2AVI (Oxygen Availability Index) measures the oxygen delivery indexed to BSA.
Normal: 550-650ml/min/m2
VO21 (Oxygen Consumption Index) amount of oxygen consumed by the tissue per minute indexed to BSA.
Normal: 115-165ml/min/M2
O2ER (Oxygen Extraclion Ratio) reflects the use of oxygen by the tissues. It is the fraction of available oxygen that is consumed by the tissues.
Normal: 24-28%
AaDO2 or A-a Gradient (Alveoli-Arterial Oxygen Difference) measures the difference in partial pressure of oxygen between the alveoli and the arteries. This measures the efficiency of the oxygen exchange between the lung alveoli and the pulmonary capillaries.
Normal: 10-15mmHg
QS/QT (% of Arterio-venous Shunt) is the extent to which arterial blood is less than maximally oxygenated. It is the blood returning to the left heart without being oxygenated. It measures the amount of shunting.
Normal: 3-5
EJ (Ejection Fraction) is stroke volume expressed as a percentage of end diastolic volume.
Normal: 65%
SvO2 (Mixed Venous Oxygen Saturation) represents the end result of both oxygen delivery and consumption at the tissue level. Can be the earliest indicator of acute deterioration. It is determined by four interacting variables: SaO2, Cardiac Output, Hemoglobin, and O2 Consumption. It is drawn from the PA port of the Swan Ganz because it is blood that has been blended in the Right Ventricle. It is a mixture of blood from the Inferior Vena Cava, Superior Vena Cave, and the Coronary Circulation.


